Enclosing radially convex set
Given a set of circles in the plane, let us find a star-shaped (radially convex) region that encloses all of them while minimizing a weighted sum of area and perimeter.
The enclosing shape is parameterized by its center \((c_x, c_y)\) and K radii at uniformly-spaced angles \(\theta_k = 2\pi k / K\). The boundary point at angle \(k\) is: $\(p_k = \text{center} + r_k \begin{pmatrix} \cos\theta_k \\ \sin\theta_k \end{pmatrix}\)$
The optimization minimizes a weighted sum of enclosure violation, area, and perimeter.
The enclosure loss penalizes squared violations of \(r_k \geq (\mathbf{c}_i - \mathbf{c}) \cdot \hat{\theta}_k + r_i\), i.e. the star boundary must extend at least as far as each circle's support in every sampled direction.
import matplotlib.pyplot as plt
import networkx as nx
import numpy as np
from IPython.display import SVG
#from jax import numpy as jnp

from vizopt.animation import SnapshotCallback
from vizopt.base import OptimConfig
from vizopt.templates.euler.stars_vs_circles import EulerDiagram
Allowing circles to move
from vizopt.examples.sets import make_overlapping_circles_example

circles, sets, offsets = make_overlapping_circles_example()

diagram = EulerDiagram(
    circles,
    sets,
    weight_area=1.0,
    weight_perimeter=2.0,
    weight_exclusion=10.0,
    weight_smoothness=2.0,
    weight_position_anchor=1.0,
    weight_circle_collision=100.,
    offsets=offsets,
)
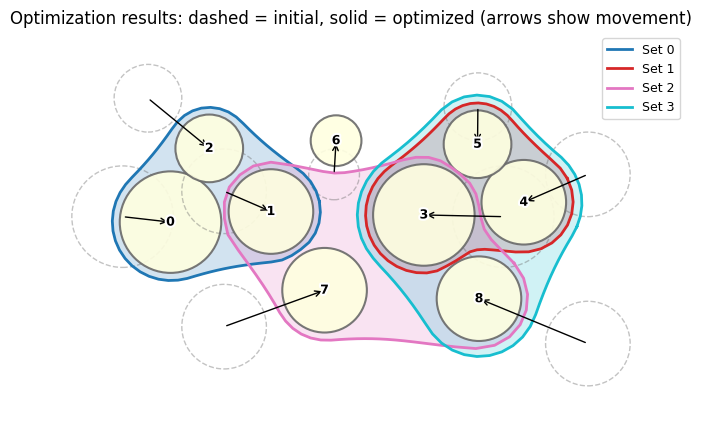
diagram.optimize(OptimConfig(n_iters=10000, learning_rate=0.002))

diagram.plot(show_arrows=True)
plt.title("Optimization results: dashed = initial, solid = optimized (arrows show movement)")
plt.show()
British Islands — joint multi-set and circle layout
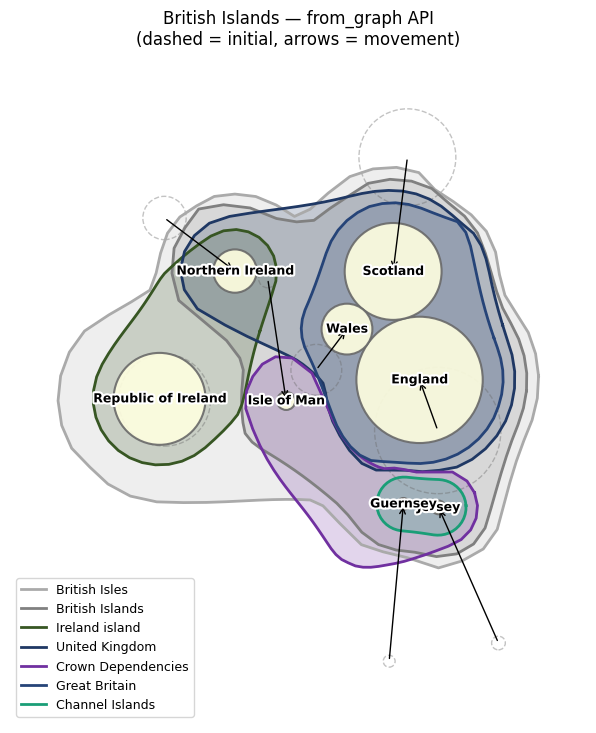
The British Islands have a natural nested set structure:
- Great Britain contains England, Scotland, Wales
- United Kingdom contains Great Britain + Northern Ireland
- British Islands contains United Kingdom + Jersey, Guernsey, Isle of Man
We optimize both the star-shaped boundaries of each set and the positions of the element circles simultaneously.
from vizopt.examples.sets import make_british_islands_graph

inclusion_graph = make_british_islands_graph(include_british_isles=True)

# Compute per-set offsets from nesting depth (same logic as above)
set_names_fg = [n for n in nx.topological_sort(inclusion_graph) if inclusion_graph.out_degree(n) > 0]
leaf_set_fg = {n for n in inclusion_graph.nodes if inclusion_graph.out_degree(n) == 0}
nesting_depths_fg = [
    max(nx.shortest_path_length(inclusion_graph, s, leaf) for leaf in leaf_set_fg if nx.has_path(inclusion_graph, s, leaf))
    for s in set_names_fg
]
offsets_fg = np.array([[0.15 + 0.2 * d] for d in nesting_depths_fg])

snapshot_cb_fg = SnapshotCallback(every=100)

diagram_fg = EulerDiagram.from_graph(
    inclusion_graph,
    weight_area=1.0,
    weight_perimeter=2.0,
    weight_exclusion=20.0,
    weight_smoothness=3.0,
    weight_position_anchor=3.0,
    weight_circle_collision=100.0,
    weight_set_attraction=1.0,
    circle_collision_alpha=1.0,
    offsets=offsets_fg,
)
diagram_fg.optimize(OptimConfig(n_iters=3000, learning_rate=0.002), callback=snapshot_cb_fg)
print(f"Sets: {diagram_fg.set_names}")
print(f"Circles: {diagram_fg.leaf_names}")
print(f"Captured {len(snapshot_cb_fg.snapshots)} snapshots")
diagram_fg.plot(show_arrows=True)
plt.title("British Islands — from_graph API\n(dashed = initial, arrows = movement)")
plt.show()